
Why most traders fail despite being right more than half of the time
and how Kelly sizing and smarter stops can flip the odds.


Average retail traders win more than 50% of their trades. So why do 97% of day traders still lose money?
Long-term studies show that even though traders are right more than half the time, fewer than 1% can consistently generate meaningful returns. The vast majority lose. Even in professional setups, profitability is rare.
The Real Reasons Behind the Losses
A big part of the problem is emotional decision-making. One common bias is loss aversion — losses feel more painful than equivalent gains, so traders delay taking the hit (not realized, not a loss). Another is anchoring — fixating on the entry price and holding a loser in the hope it returns to break-even. Add to that the lack of stop losses, overconfidence in analysis (or no real analysis at all), and poor position sizing — often risking too much on a single trade — and you have a recipe for disaster.
Position Sizing: Using the Kelly Criterion
While much of the problem is psychological, issues like position sizing can be addressed mathematically using the Kelly Criterion.
Idea in a nutshell: If you bet too little, you fail to fully exploit your edge; if you bet too much, you risk large drawdowns or even ruin. The Kelly Criterion finds the sweet spot that maximizes long-term compound growth over repeated bets.
Formula (binary outcome, win or lose):
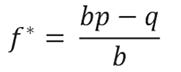
Where:
f* = fraction of your bankroll to wager
b = odds received (net odds; e.g., if you get 3-to-1, then b=3)
p = probability of winning
q=1−p = probability of losing
Example: Day Trading Stats (from backtests/live trades. Plug your own stat)
Win rate: p=0.55 (55% of winning trades)
Loss rate: q=1-p=0.45 (45% of losing trades)
Average win: +$250
Average loss (stop loss): -$150
Payoff ratio:
b = Average Win / Average Loss = 250/150 = 1.67
Applying the formula:
f* = (1.67 * 0.55 – 0.45) / 1.67 = 0.28 = 28%
Kelly suggests risking no more than 28% of bankroll (account size) per trade.
Translating “Risk” Into Position Size
Here, “risk” means the loss if your stop is hit.
Example:
Bankroll = $50,000
Max loss per trade (Kelly) = 0.28 × $50,000 = $14,000
Stop loss = $150 per share/contract
Position size = 14,000/150 ≈ 93 shares/contracts
Kelly can be aggressive. Many pros use half-Kelly:
Risk = 14% of bankroll per trade → $7,000 at risk → ~47 shares/contracts.
Translating Kelly Into Asset Units
Stocks
Shares = Dollar Risk / Stop Loss in $ per share
Example:
$7,000 risk, $3 stop → 7,000 / 3 ≈ 2,333.
Futures
Contracts = Dollar Risk / (Stop Loss in ticks × $ per tick)
Example (E-mini S&P 500, $12.50 per tick): $2,500 risk, 10-tick stop → 2,500/(10×12.5)=20 contracts.
Options
Contracts=Dollar Risk / (Premium×100)
Example: $1,000 risk, $2.50 premium → 1,000 / (2.5×100) = 4 contracts.
!Fact: Financial institutions use similar logic when deciding maximum exposure to a borrower or pricing insurance policies.
One of my favorite books, A Man for All Markets by Edward Thorp — the mathematician who beat baccarat and blackjack before becoming a hugely successful investor — explains how he used Kelly principles for bet sizing. Highly recommended for any aspiring trader or investor.
Optional reading: Stop Losses, avoiding premature exits
The stop-loss method that has proven most effective over time is a structure-based stop with a volatility buffer.
Instead of setting a fixed % stop, place your stop just beyond a logical technical level that would invalidate your trade — for example, a recent swing low for a long position or a swing high for a short. Then add a volatility buffer, often 1–2× the Average True Range (ATR), to avoid being stopped out by normal price noise or “stop hunts.”
This ensures your stop is placed outside typical market fluctuations while still protecting you if the trade truly fails. The key is to adjust your position size so the wider stop doesn’t increase your dollar risk. This approach keeps you in trades longer, reduces premature exits, and enforces discipline when your original thesis is no longer valid.
How to Calculate ATR
The Average True Range (ATR) measures market volatility. It’s calculated as the average of the True Range over a set number of periods (for example, 14 days for swing trades or 14 bars for intraday).
True Range (TR) for each period is the largest of:
Current High − Current Low
|Current High − Previous Close|
|Current Low − Previous Close|
ATR formula:
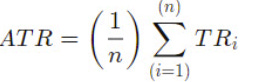
where n is the number of periods (e.g., 14).
Example: If the past 14 daily TR values sum to $28, then:
ATR= 28 / 14 = 2
If you use a 2×ATR stop, you’d set your stop $4 away from your entry (2 × 2).
Worked Example: Kelly + ATR Stop Placement
Let’s put it all together.
Step 1 – Your trade stats:
Account size: $50,000
Win rate: 55%
Avg win: $250
Avg loss: $150
Payoff ratio: b=1.67 → Kelly fraction = 0.28 (28%)
Step 2 – Kelly risk in dollars:
0.28 × $50,000 = $14,000 risk per trade (full Kelly)
Half-Kelly = $7,000 risk per trade
Step 3 – Determine ATR stop:
ATR(14) = $2
Volatility buffer: 1.5 × ATR = $3
Logical stop level (support) is $100 → Final stop = $97
Step 4 – Position size:
Dollar risk per share = $100 − $97 = $3
Position size (half-Kelly) = $7,000 ÷ $3 ≈ 2,333 shares
Step 5 – Outcome:
If stopped out at $97, loss = 2,333 × $3 = $6,999 (~14% of account, half-Kelly).
If target hit with $6 profit/share, gain = ~$13,998.
This way, you size your trade scientifically, place the stop outside normal market noise, and keep your risk per trade exactly where you want it.
Happy Trading!